AI tools and automation
@apurv_sngh
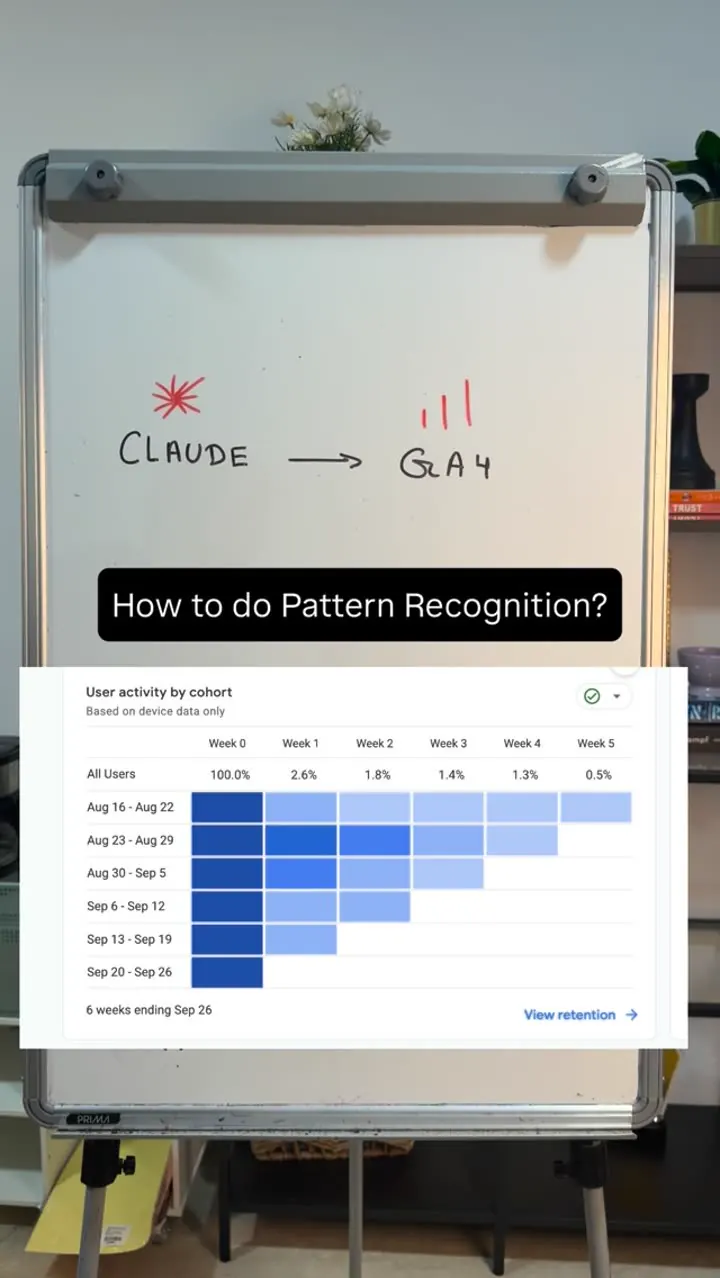
Use GA4's Cohort (retention) report with Claude to find patterns between what you posted/changed (reels, influencers, site changes, campaigns) and whether users come back in weeks 2-4 and go deeper (PDP, cart, checkout, purchase); the setup guide + prompts are gated behind comment "pattern".
16k plays · 30 Sep 2026
What they said
- The GA4 cohort report shows people who came to the site in week 1 and how many returned in weeks 2, 3 and 4.
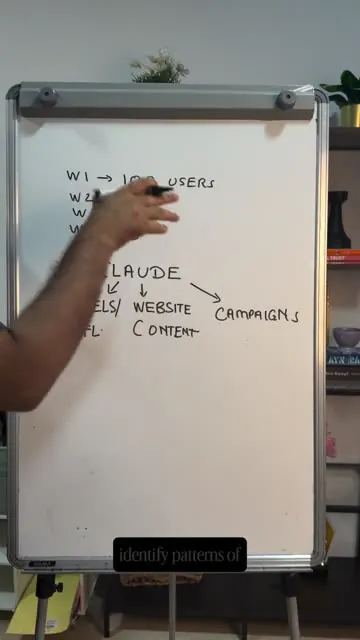
- Example: week 1 = 100 users; whiteboard row values 100 -> 20 -> 10 -> 5 for weeks 1-4 (the creator says "out of these 100... if anyone came back in week 2, week 3, week 4"; later "out of these 20 people...").
- Don't stop there. Of the returning users (20 in the example), analyse how many bounced from a product page, how many reached the cart page, and whether they bought. Whiteboard: PDP -> CART -> CHECKOUT -> PURCHASE. Repeat this for the rest of the cohort users.
- Use Claude for pattern recognition: for weeks 2-4, list what reels you posted, any influencer marketing, what changes you made on the website, and any new campaigns activated. (Whiteboard: Claude -> {Reels/Influencers, Website, Content, Campaigns} -> "Patterns")
- Over time you identify which content, website changes and campaigns bring people back and how deep they go on the platform.
- CTA: comment "pattern" and he sends the full setup guide and prompts.
Try this
- Store owners: Open the GA4 Cohort report and see how many week-1 visitors return in weeks 2, 3 and 4. The example goes from 100 to 20 to 10 to 5.
- Store owners: For returning users, check how many reached the product page, cart, checkout and purchase.
- Anyone with data: Keep a dated change log of reels, influencer posts, site changes and campaigns. Give it and the cohort numbers to an AI assistant and ask which changes line up with better return rates.
- Brands with repeat purchases: Use customer cohorts from your store or order system, not only site visitors, and compare reorders with your reminder messages.
- Agencies: Offer an analytics review with an annotated change log template as a retainer item.
- Caution: GA4 cohort numbers are often small. The screenshot shows 2.6% week-1 retention, so judge only when samples are large enough.
Links
- Google Analytics 4: Retention > "User activity by cohort" (screenshot: weekly cohorts such as Aug 16-22, Aug 23-29..., with retention % across Week 0-5, e.g. All Users 100.0%, 2.6%, 1.8%, 1.4%, 1.3%, 0.5%).
- Claude (Anthropic) for analysis; no specific prompt shown in the video.
- Gated: "full setup guide along with prompts".

Watch the original
Watch the full reel on Instagram by @apurv_sngh. Follow them for more.
Video, voice and ideas belong to @apurv_sngh. Shown here as a short preview with our own summary, for commentary and education. Want it removed? Tell us.
00:00
/
00:00

More AI tools and automation



Liked this one? Get the next
When I find a reel worth acting on, you get the short version: what it says and what to do. Free, rare, one click to leave.
Rather have it done for you? Work with Tanish